Video games used to be something only a few people played. Now, they’re a huge part of life all over the world. In 2024, billions of people play games on phones, computers, and game consoles. Kids, adults, and even grandparents are playing. It’s not just for fun anymore. It’s a big business and a big part of how people spend time together.
In this article, we’ll look at what’s going on in the gaming world. We’ll talk about how big the market is, what kinds of games people play, who’s playing, and how the business is changing. From mobile games to older gamers to new ways companies make money, the numbers help tell the story of why gaming keeps growing.
Key Takeaways
- In 2024, 3.42 billion people played video games — a 4.5% increase over 2023.
- Global game revenue for 2024 is forecast at $187.7 billion, up 2.1% YoY.
- Mobile gaming leads the market with $92.6B (49%) and the fastest growth rate.
- Asia-Pacific generates 48% of global revenue, with China contributing over half of that share.
- In the U.S., 190.6 million people (61%) play games weekly — gaming is now mainstream.
- 46% of players are women, bringing the gender split near parity.
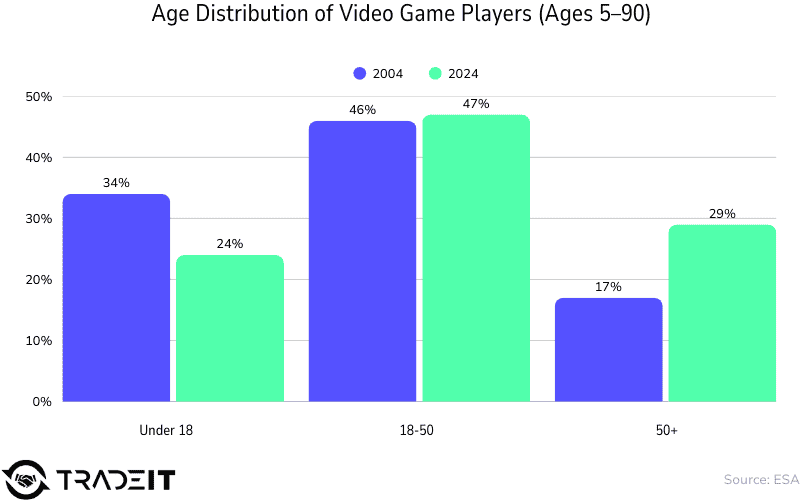
- The average gamer is 36; nearly 30% are 50+, proving gaming spans all generations.
- Esports revenue in 2024 hit $1.6B, with the U.S. leading at $1.1B, surpassing China.
- At a projected 13.4% CAGR, the gaming industry could grow from $230B (2023) to $558B by 2032.
Market Growth & Forecasts
The industry keeps growing, though not in leaps and bounds anymore. Growth feels more grounded, now confident, sustained. The U.S. and China remain the primary drivers of the revenue, but it’s the emerging markets India, the Middle East, andAfrica thatt are worth watching. Although their growth may be smaller in absolute terms, the energy is unmistakable. It’s not just about scale anymore; it’s about momentum.
| Region | 2025 Revenue | 2030 Forecast | CAGR |
|---|---|---|---|
| Global | $269B | $436.7B | 10.2% |
| United States | $63.4B | $99.3B | 9.4% |
| India | $4.0B | $8.4B | 15.7% |
| Middle East & Africa | — | — | 13.5% |
Platform & Technology Trends
Mobile is still where the money is, and that won’t change anytime soon. But it’s not the full story. PC and console still matterespecially for depth and engagement. New hardware is arriving, big franchises are bouncing back, and players expect their games to work across everything. Developers, in turn, are adjusting to a world where no single platform can be ignoredand where markets are getting noisier by the month.
| Platform | Revenue Share | Growth Trend | Notes |
|---|---|---|---|
| Mobile | ~50% | +11% annually | Largest & fastest-growing segment |
| Console | Catching up | +7% annually | Outpacing PC growth post-pandemic |
| PC + Console Core | $80.2B (2024) | $92.7B (2027 est.) | Strong, loyal player base |
| VR/AR (XR) | Declining | -6% dev interest YoY | Only 36% of devs still targeting XR |
- Mobile now represents half the business, supplying ~50 % of global revenue and growing ~11 % a year, so studios increasingly aim their resources at smartphones.
- A console comeback is underway: after the pandemic dip, console revenue should outpace PC from 2025 as new hardware and blockbusters rekindle engagement.
- The PC-console core stays lucrativeworth about $80.2 B in 2024 and projected at $92.7 B by 2027, with console sales rising ~7 % annually despite mobile’s surge.
- Multi-platform play is mainstream; 19 % of U.S. gamers use console + PC + mobile, so big franchises now launch everywhere.
- The time-spent gap shows lean-forward habits: PC/console users average 2.1 h a day vs 1.6 h on mobile.
- VR/AR enthusiasm icooling, with onlyly 36 % of devs building for XR, down from 42 % in 2022, as adoption lags the hype.
- Meta Quest still leads XR work (40 % targeting Quest, 34 % with titles in development), while Apple Vision Pro already attracts 30 % interest and 13 % planned launches, hinting at renewed high-end optimism.
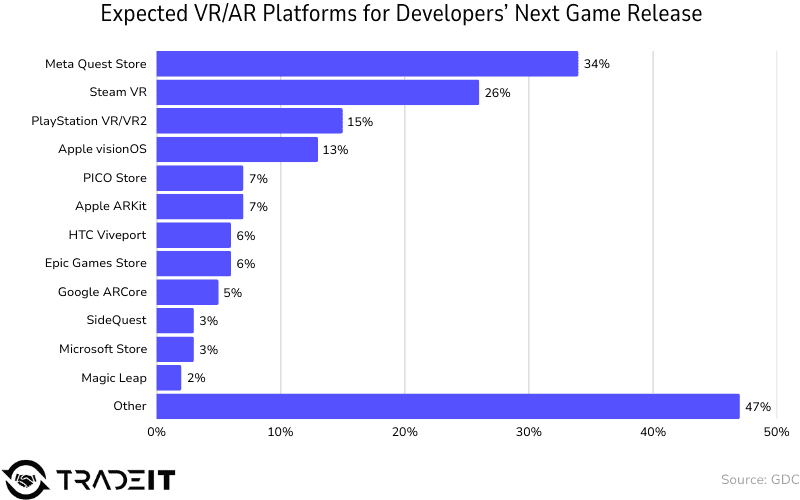
- Next-gen buzz centers on Nintendo: 32 % of devs eye a Switch successor, topping the 29 % building for Xbox Series X|S, so platform priorities may pivot again.
- A mobile-dev pullback is clearjust 24 % target Android and 23 % iOS, a 16 % YoY drop as saturation and UA costs bite.
Player Demographics
| Metric | Stat |
|---|---|
| Total Global Players (2024) | 3.42 billion |
| Projected by 2027 | ~3.75 billion |
| U.S. Weekly Players | 190 million (61%) |
| Average Gamer Age | 36 |
| Players Aged 50+ | ~29% |
| Global Gender Split | ~54% male / 46% female |
| Gen Alpha Gaming Rate | 94% |
| Gen Z Gaming Rate | 86% |
| Boomers Gaming Rate | ~50% |
Gaming used to be a young person’s world. Not anymore. The average player is in their mid-30s, and a surprising number are well past 50. Mobile has helped open the door, especially for women, and the result is a player base that’s more representative of the world around it. That shift is still unfolding; it’s already changing how games are made, marketed, and played.
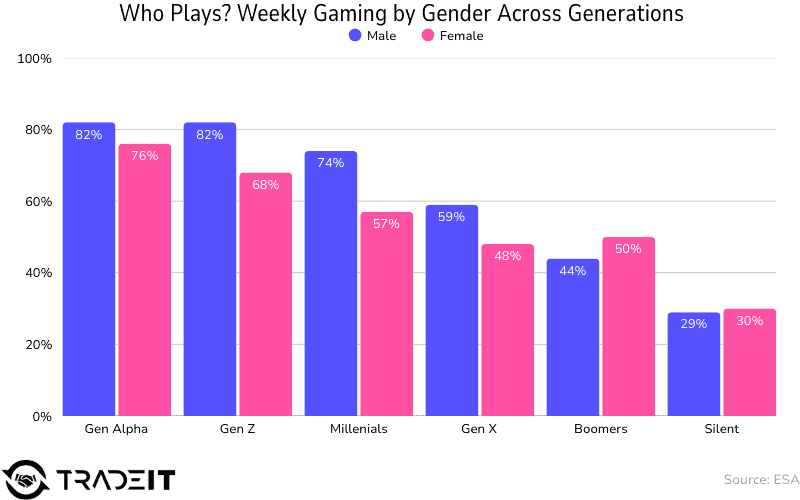
- Gender parity has arrived: women make up ~46 % of players worldwide, matching men across age groups.
- Mobile engagement skews femalein the UK, women are 55 % of mobile gamers and play 40 % longer; women 65 + log 25 h/month.
- Generational uptake keeps rising: 94 % of Gen Alpha (< 13) and 86 % of Gen Z gamed last year versus 50 % of Boomers.
Social & Community Impact
Games have always been fun. Increasingly, though, they’ve also become social glue. Whether it’s siblings bonding over co-op, old friends staying connected through online matches, or entire communities forming around shared fandoms, gaming has found a unique way to bring people together. The connections feel real because, in many cases, they are.
- 88 % of players game online in 2024 vs 18 % in 1999, and 74 % join others weekly, turning gaming into a communal pastime.
- Family bonding through games is common83 % of gaming parents play with their kids, 51 % weekly, making gaming the new family game night.
- 73 % of adult gamers have met friends in-game, and 39 % found a partner, rivaling social media’s networking power.
- 82 % of Gen Z/Alpha call gaming spaces inclusive, boosting loyalty.
- Motives diverge: relaxation (68 %) and fun (67 %) lead overall, but Boomers prize mental stimulation (92 %), while 71 % of Gen Z prioritize socializing.
- The generational shift in attitudes shows 77-79 % of Americans see games as joyful and stimulating, yet 71 % of Gen Zversus only 21 % of Boomersview gaming as a relationship-builder, proving perceptions evolve as gaming-native cohorts age.
Player Engagement & Behavior
Players are still spending serious time in games. But that time is clustering few big titles are soaking up most of the attention. The rest? They’re scrambling for what’s left. It’s become an attention economy where reach is uneven and breakout success is harder to come by.
- The industry is witnessing a playtime surge: gamers logged 6 % more hours in 2024, and Q4 set a recorddeven though new-player growth has slowed.
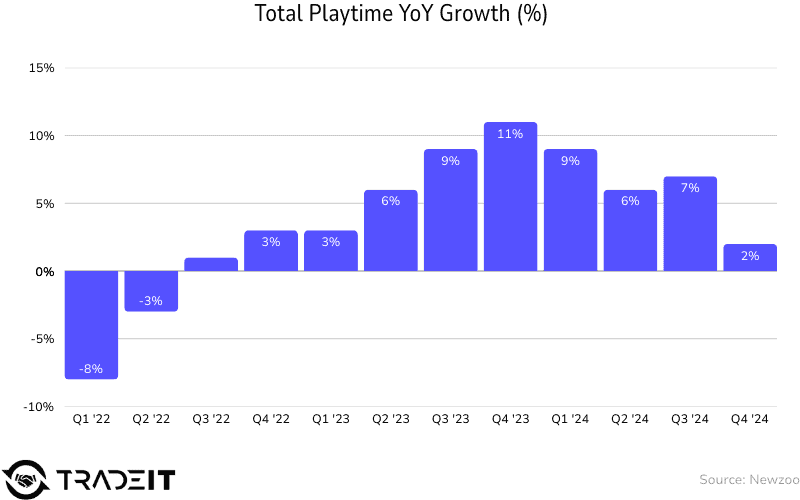
- This attention squeeze is starkjust 10 blockbuster titles soak up roughly half of all gameplay hours worldwide, leaving newcomers little room to break through.
- Players now stick to fewer main games; on Steam, 34 % mostly play only 1–3 titles (up from 22 % in 2021), with similar shifts on PlayStation (31 %) and Xbox (32 %).
| Platform | % of Users Playing Only 1–3 Games |
|---|---|
| Steam (PC) | 34% |
| PlayStation | 31% |
| Xbox | 32% |
- Their enduring legacy of love shows on PC, where 67 % of playtime goes to games six-plus years old, compared with 44–49 % on consoles.
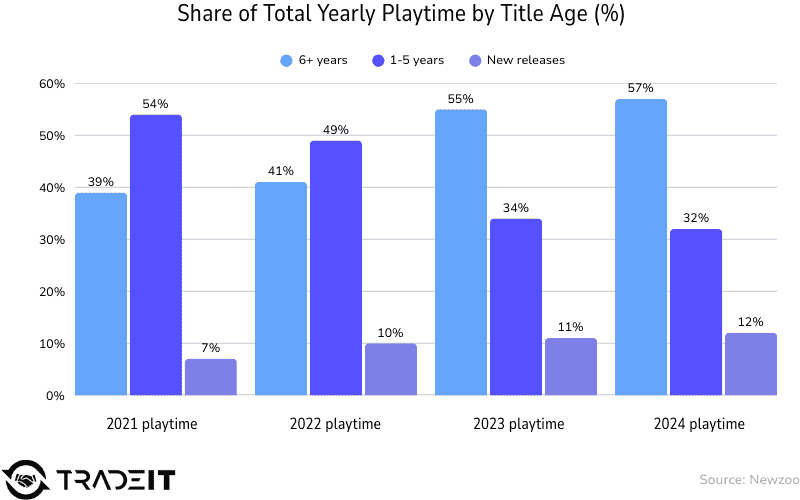
- About 31 % of PC/console users are dedicated trend-seekers who hunt for the latest releases79 % of them play on multiple platforms, and 34 % use all three.
- These early adopters are big spenders: 82 % bought a game in the past six months, and 94 % also watch gaming video content.
- Well-timed transmedia tie-ins pay off; trend-seekers are 81 % more likely to buy DLC or merchandise after pop-culture collaborations.
- For Gen Alpha, social play dominates: 71 % enjoy 1-v-1 duels, and 68 % lean into co-op, so designers must build competitive and cooperative hooks for this cohort.
Content & Genre Trends
The old favorites still hold upshooters, puzzles, open-worldadventurest the edges are shifting. Storytelling is evolving. More inclusive characters, nostalgic callbacks, and deeply immersive worlds are setting the tone. And preferences often shift depending on the platform, making it harder for any one formula to dominate.
- Shooters still rule: projected to pull in $7.4 B on PC (17 %) and ~16 % of console sales in 2024, thanks to evergreen competitive multiplayer.
- Fortnite dominates with 9.3 % of all gameplay time; its “OG” season lifted its share of Battle-Royale players to 77 %, up from 43 % in 2021.
- Genre fortunes split by platform: PC adventure-game revenue rose 21 %, while console adventure fell 14 %, underscoring different audience tastes.
- After plateauing, the Battle-Royale segment is growing again across PC, console, and mobile on fresh modes and content.
- Nostalgia can paybut unevenly: Fortnite’s throwback tripled engagement, whereas Destiny 2 and Overwatch saw only single-digit bumps.
- On mobile, Honor of Kings earned $1.87 B in 2024; with Monopoly GO! and Royal Match, the top three titles grossed $4.9 B combined.
- Candy Crush Sagalaunched in 2012still cleared $1.08 B last year, proving well-maintained casual hits can thrive for a decade.
- Seven of Android’s 2025 top-10 downloads were simple puzzle/sim titles; an offline-games bundle hit 9.6 M installs in a month.
- Surveys show 66 % of core players want vast open worlds, 42 % enjoy survival themes, and 38 % prize cutting-edge visuals, driving investment in sprawling, pretty survival sandboxes.
- Inclusive stories matter: 68 % of narrative-focused gamers expect diverse representation, so more big releases now feature varied casts and viewpoints.
Monetization & Business Models
| Platform | Revenue Model Highlights | Avg Revenue/1M Players |
|---|---|---|
| Console | $70 games, DLCs, subscriptions | $82K |
| PC | 58% revenue from microtransactions | ~$24.4B |
| Mobile | 71% play only F2P, monetized via cosmetics | Lower than console |
There’s no one-size-fits-all approach to making money in games anymore. Consoles still generate more revenue per player, but mobile reaches far more people. And in between, hybrid modelspart free-to-play, part subscription, part merch or mediaare starting to feel like the norm. Microtransactions, for better or worse, aren’t going anywhere. Neither are tie-ins with movies, shows, and influencers.
- Consoles monetize best: about $82 K per million players, roughly 2.5× mobile’s revenue per head, thanks to $70 games, DLC, and subs.
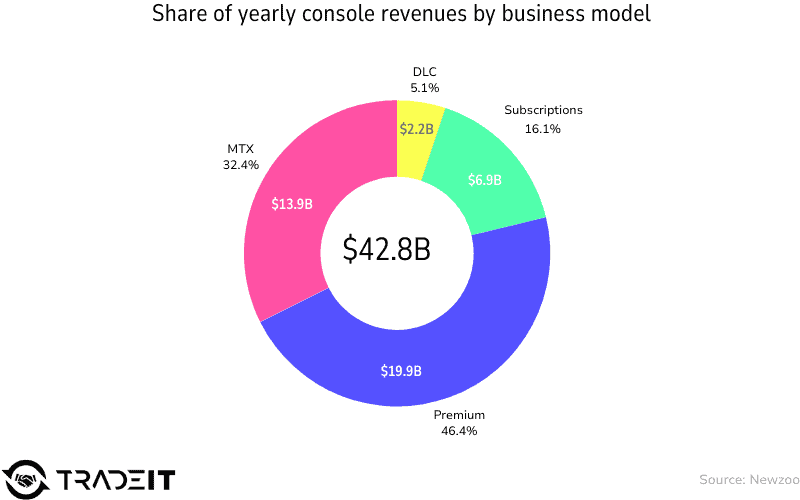
- PC relies on micro-transactions (58 % of revenue, ~ $24.4 B), while console-subscription spend jumped 14 % YoY to $6.9 B through Game Pass, PS Plus, etc.
- Free-to-play dominates mobile (71 % play only F2P), but 26 % of console users still prefer pay-up-front titles; just 7 % of mobile players do.
- Spending depth differs: 51 % of console and 28 % of mobile users drop ≥ $5 a month on games.
- Virtual currencies and cosmetic add-ons are the top in-game purchases, embedding micro-spending in everyday play.
- Hybrid models are now common, yet a bare majority of devs (51 %) still rely on full-price sales as their main revenue pillar.
- Big IP goes cross-media: 25 % of AAA studios have game-to-film/TV projects, vs ~10 % industry-wide, leveraging franchise power.
- Launch discount clout is fading: visibility multipliers slid from 38× (2019) to 7× (2024) amid 18,900 Steam releases last year, so early spikes are harder to secure.
Industry & Workforce Trends
Layoffs, workplace concerns, questions around AIit’s all in flux. But you also see small studios punching above their weight, remote teams doing remarkable work, and a generation of talent asking tougher questions about what this industry should become. There’s tension, yesbut also a lot of hope.
- The talent pool is distinctly young: 56 % of developers have under ten years’ experience, underscoring the surge of new hires in the 2010s.
- Leadership diversity lags the audience: among senior decision-makers (21 + years in), 87 % are men and 92 % are white.
- Small-team dominance remains the norm57 % of devs work at studios with fewer than 50 staff, and 32 % sit in indies, fueling innovation but adding volatility.
- Remote work is now the default: 74 % of companies keep offices optional or hybrid, solidifying distributed game-dev workflows.
- Layoff anxiety persists35 % felt recent cuts (especially QA at 22 %), and 56 % fear more despite record revenues.
- A wave of acquisitions has bred merger fatigue: only 5 % see big deals as positive, while 85 % call them negative or mixed.
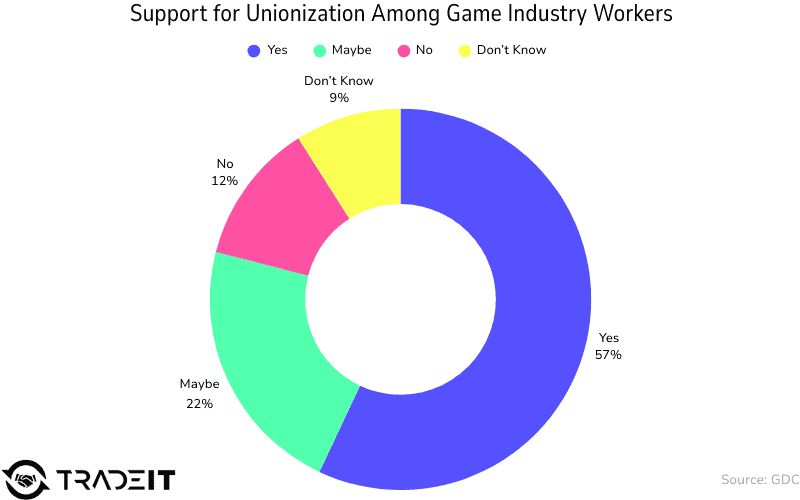
- Union momentum is building: 57 % support unionization (72 % among 18–24-year-olds), though just 5 % are union members so far.
- Studios stay PC-first while engines form a duopoly: 66 % are shipping to PC now; Unity and Unreal each power about one-third of projects, though 28 % considered switching, mostly toward Godot.
- Developer focus is shifting as mobile interest falls to 24 % (Android) and VR/AR drops to 36 %, while excitement rises for a possible new Switch.
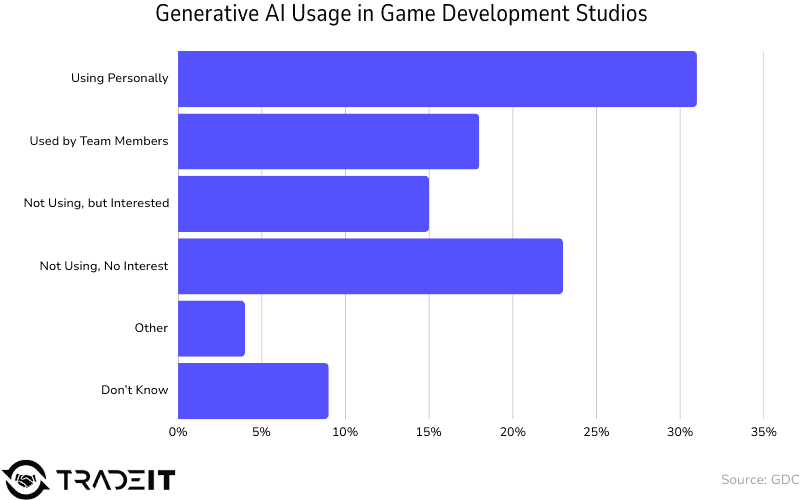
- Generative AI adoption grows49 % of studios use it (chiefly in biz/marketing), yet 84 % voice ethical worries and 32 % lack formal policies.
- Accessibility keeps improving: 48 % now add features such as captions (63 %) and color-blind modes (57 %), widening their reach.
- Sustainability efforts have slipped: firms rating their green goals “successful” fell from 90 % to 72 %; 27 % now say they’re not succeeding at all.
- newzoo.com
- ipsos.com
- mordorintelligence.com
- gdconf.com
- theesa.com
- americangaming.org
- skyquestt.com
- statista.com


