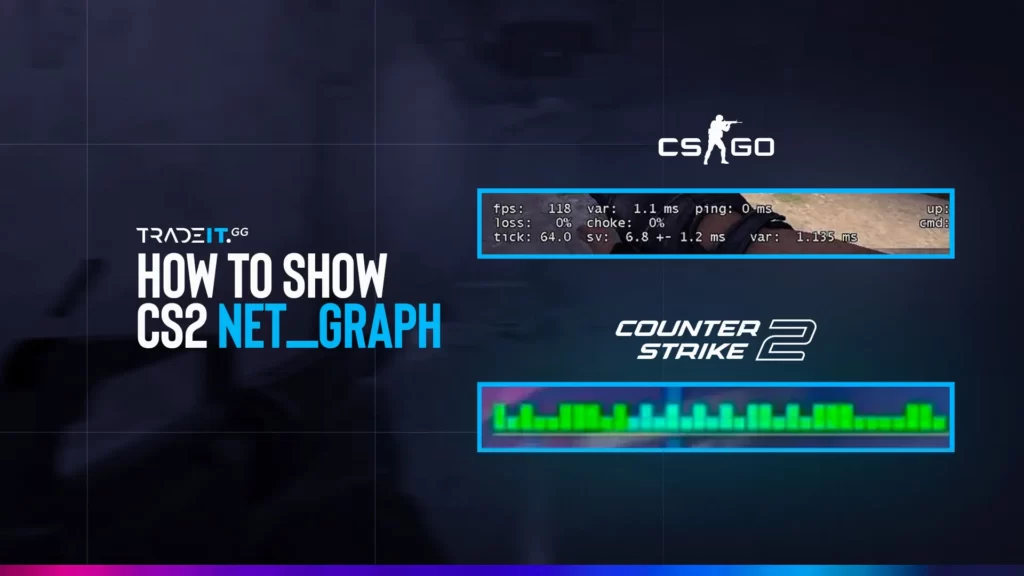
Want to keep an eye on your FPS, ping, and packet loss while playing CS2? The classic net_graph from CS:GO is gone, but don’t worry! You can still get the same performance insights using new commands.
This guide explains how to open a net graph in CS2, step-by-step. You’ll learn how to see real-time game data and monitor your connection and frame rates like a pro.
Step 1: Enable Developer Console
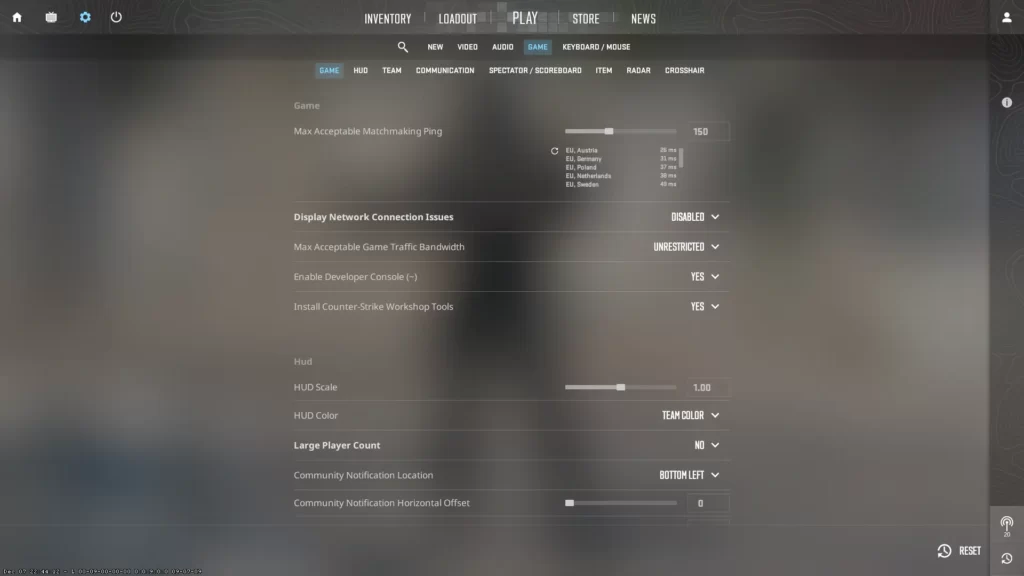
To use the net graph, first activate the console:
- Launch Counter‑Strike 2.
- Go to Settings → Game.
- Set Enable Developer Console (~) to Yes.
- Press the
~key during a match to open the console.
This setting is needed for every net graph command in CS2.
Step 2: How to See Net Graph in CS2
Since net_graph isn’t available in CS2, use these alternatives:
| Purpose | Command | Effect |
|---|---|---|
| Network stats | cq_netgraph_problem_show_auto 1 |
Shows ping, packet loss, choke in HUD |
| Frames per second | cl_showfps 1 |
Displays FPS in the top-left corner |
| Remove network HUD | cq_netgraph_problem_show_auto 0 |
Hides the network info |
| Turn off FPS | cl_showfps 0 |
Turns off FPS counter |
Related: How to Cap or Uncap FPS in CS2
Step 3: What Each Command Shows
cq_netgraph_problem_show_auto 1– Activates live network monitoring—packet loss, ping, choke—visible in the top-right corner of your screen.cl_showfps 1- Displays FPS in the top-left corner. A fast and easy way to track performance.
Bonus: Enable FPS via Steam
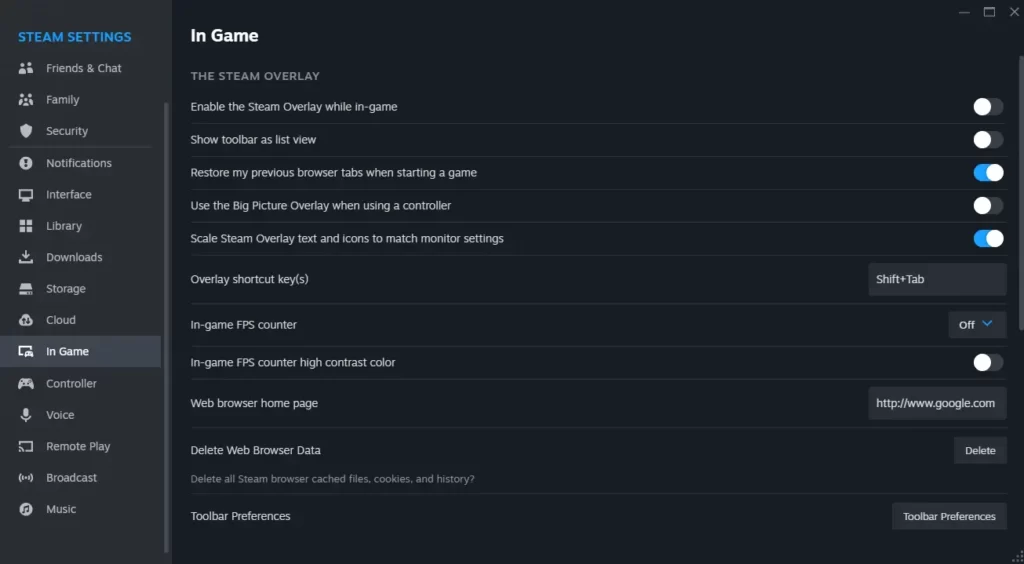
You don’t need a console if you prefer Steam’s overlay:
- Open Steam → Settings → In-Game tab.
- Under In-Game FPS Counter, choose a corner.
- Leave High contrast color enabled for easy visibility.
Step 4: Verify Everything Works
- Open a casual or deathmatch map.
- Press
~, Enter commands above. - Watch network info and FPS display.
- If it doesn’t show up, double-check the developer console settings and commands.
Frequently Asked Questions
Open the console (~), type cq_netgraph_problem_show_auto 1, press Enter. This replaces the old net_graph command.
Use cq_netgraph_problem_show_auto 1 It displays ping, packet loss, and choke in-game.
Type cl_showfps 1 In the console, or enable it through Steam under Settings → In‑Game → FPS Counter.
CS2 doesn’t support net_graph. Use cq_netgraph_problem_show_auto for network stats and cl_showfps FPS.
You can, but using built-in commands avoids compatibility issues and potential game warnings.


