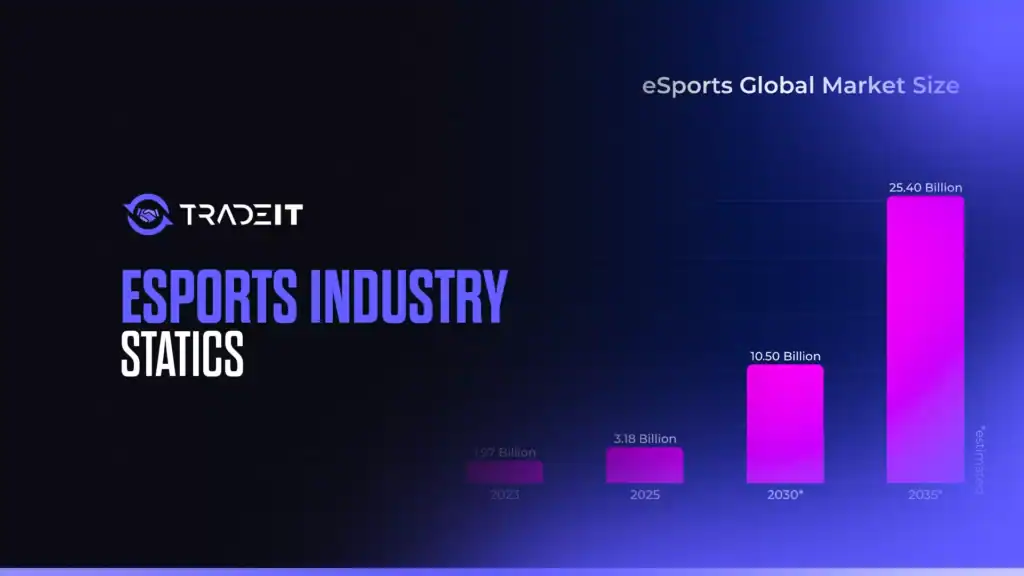
Esports has moved far beyond its roots in competitive gaming, evolving into a significant global entertainment and economic powerhouse. Its recent rise is hard to miss—more professional leagues, dedicated arenas, and a cultural sway that resonates most with younger audiences. The scene itself is complex, with fast growth, constant tech shifts, and a revolving door of new games, platforms, and business models.
This report isn’t just a deep dive for those curious about today’s esports landscape—it’s equally a practical “cheatsheet” for journalists, analysts, and researchers needing quick access to key stats and current trends. All figures here are drawn from trusted primary sources: market research leaders, specialist data platforms, and financial analysts focused on gaming and esports.
Naturally, some figures differ from source to source because of varying definitions, research methods, or timing. Still, the broader takeaway stands: every reputable report points to esports as a large and rapidly growing industry, marked by unmistakable momentum.
Key Takeaways
- The esports market is projected to grow from $2.39B (2024) to $5.18B by 2029 with a 17.5% CAGR.
- By 2025, the global esports audience is expected to reach 640.8 million viewers.
- 80% of esports fans are in Asia-Pacific, home to 1.48 billion gamers.
- The 2024 League of Legends Worlds peaked at 6.94M concurrent viewers.
- Esports World Cup 2024 had a record-breaking $60M prize pool.
- Top games by peak viewership (Q1 2025): Mobile Legends (2.8M), League of Legends (1.9M), Valorant (1.3M).
- N0tail remains the highest-earning player with $7.18M in prize winnings.
- In 2024, Twitch held 61.1% market share; YouTube Gaming grew 80% YoY.
Global Market Size & Growth Forecasts
The esports industry’s value is already substantial, though estimates vary, most agree it’s growing fast. Tracking these numbers matters, since they show just how significant and fast-moving the sector has become.
Recent market size estimates include:
- The estimated esports market size for the current year is $2.55 billion.
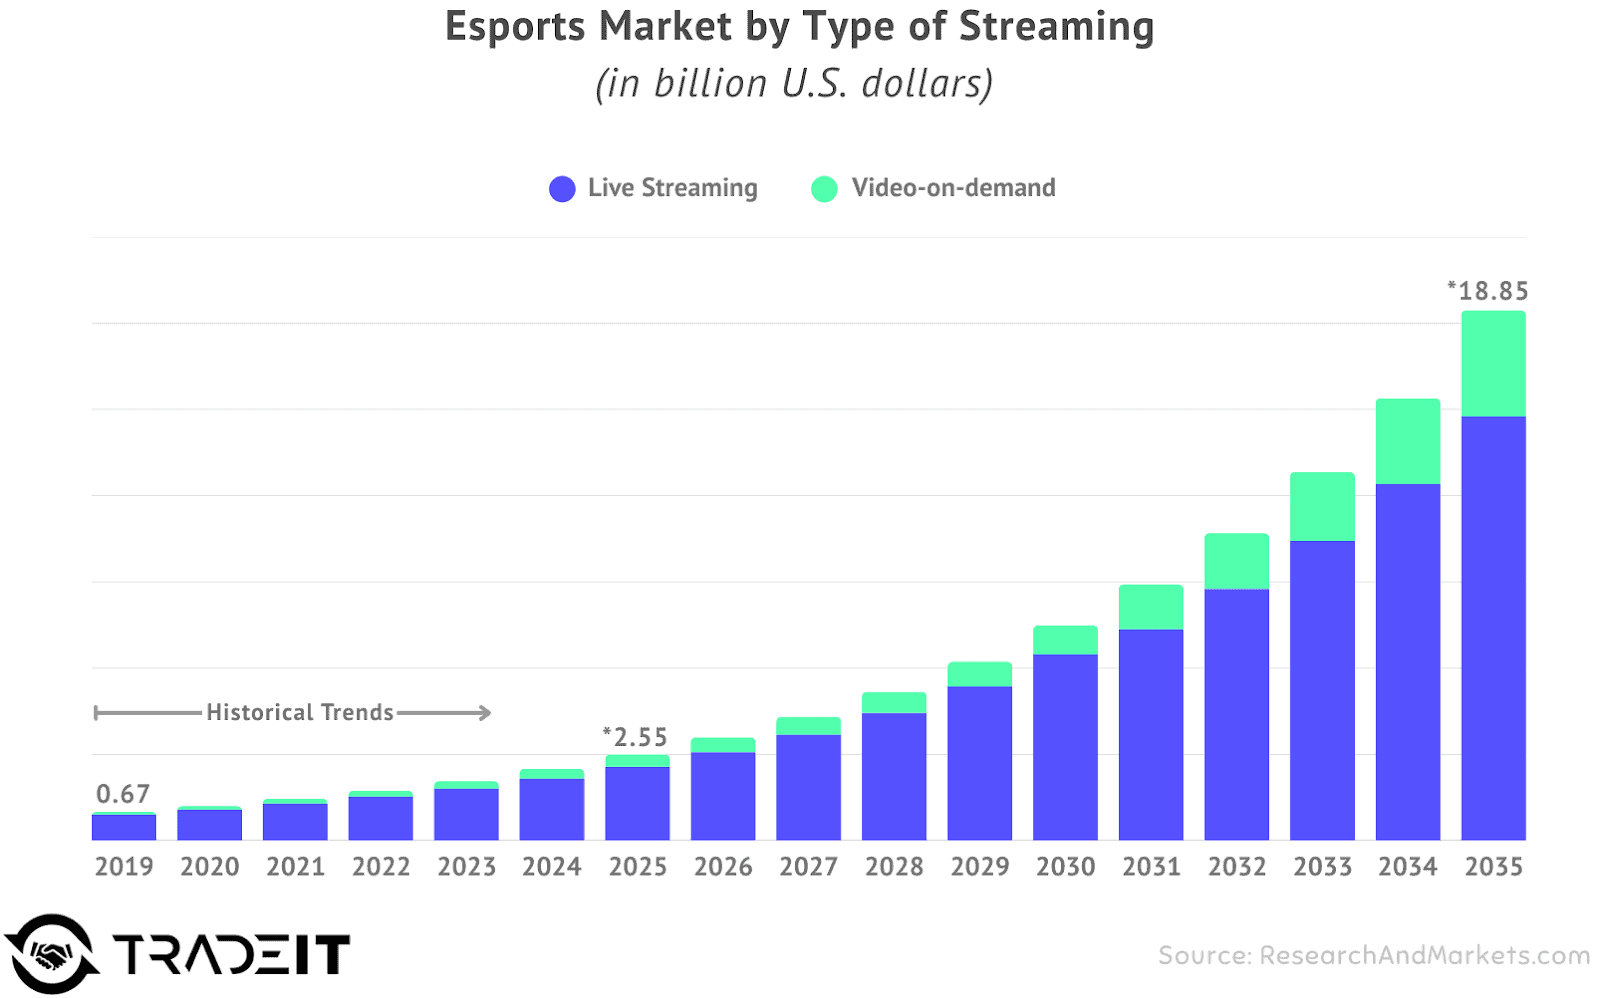
- In 2023, the market was valued at $1.97 billion.
- By 2029, the market value is expected to climb to $5.18 billion, which implies a CAGR of 17.48% from the 2023 figure.
- Forecasts indicate the market could reach $18.85 billion by 2035, reflecting a CAGR of 19.95% from the 2025 base year.
The consistent projection of strong double-digit CAGRs across multiple reports, typically ranging from 17% to 21%, signals universal agreement among analysts about the industry’s significant future expansion.
Audience Size, Demographics & Viewership
Audiences are truly the engine of esports. They generate revenue, pull in sponsors, and ultimately prove just how culturally relevant the industry has become. Here, you’ll find a breakdown of global esports viewership, demographic snapshots (often relying on recent gamer data from 2023 and up), and a look at the eye-popping audience numbers major tournaments have drawn.
Global Audience Size
- 640.8 million viewers are projected globally by the end of 2025.
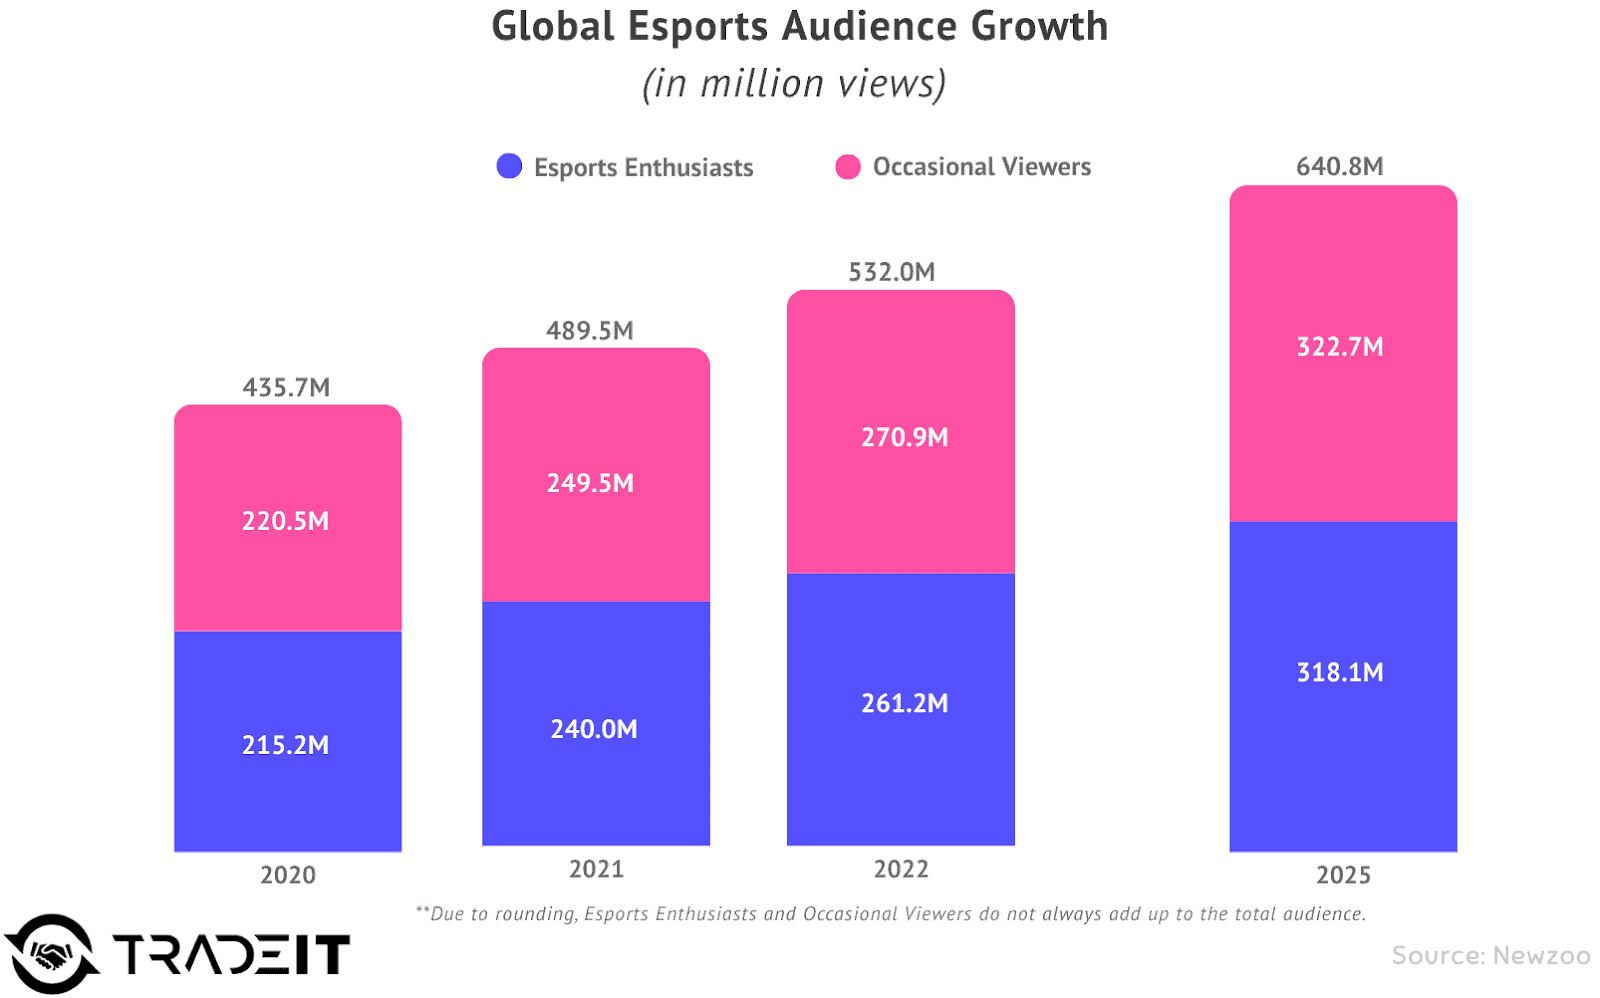
- 611 million viewers were estimated in 2024 (302M core, 308M occasional).
- 641.1 million viewers are projected by 2025, according to ASOWorld.
Audience Demographics
- 3.32 billion active video game players existed globally in 2024.
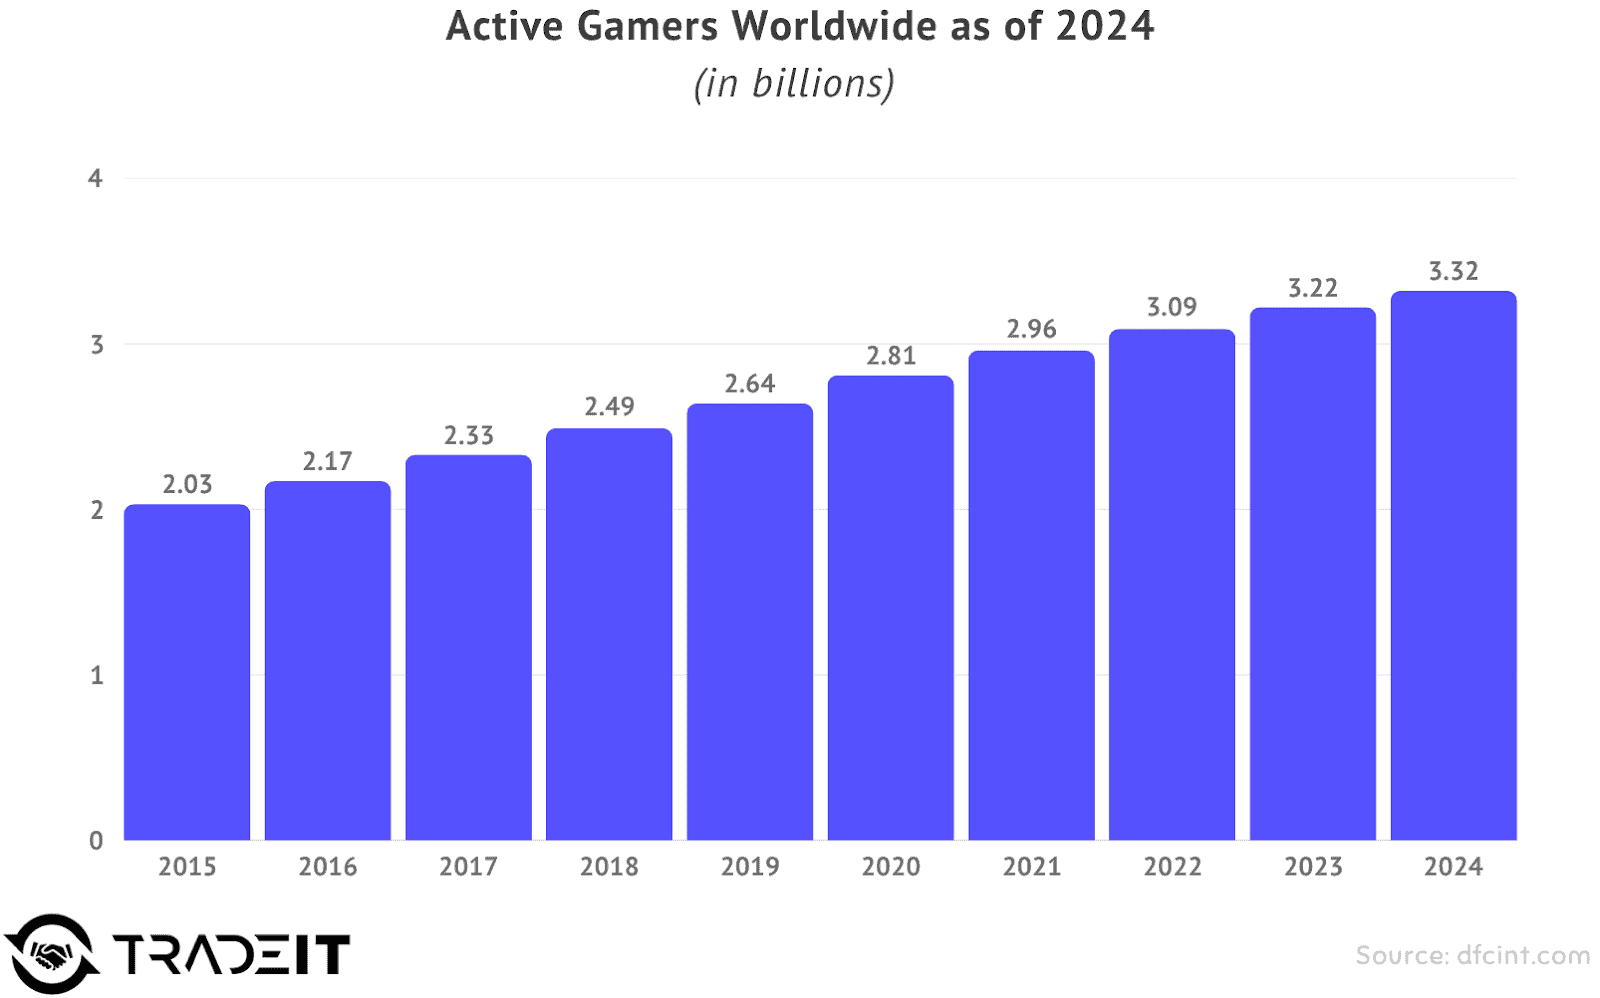
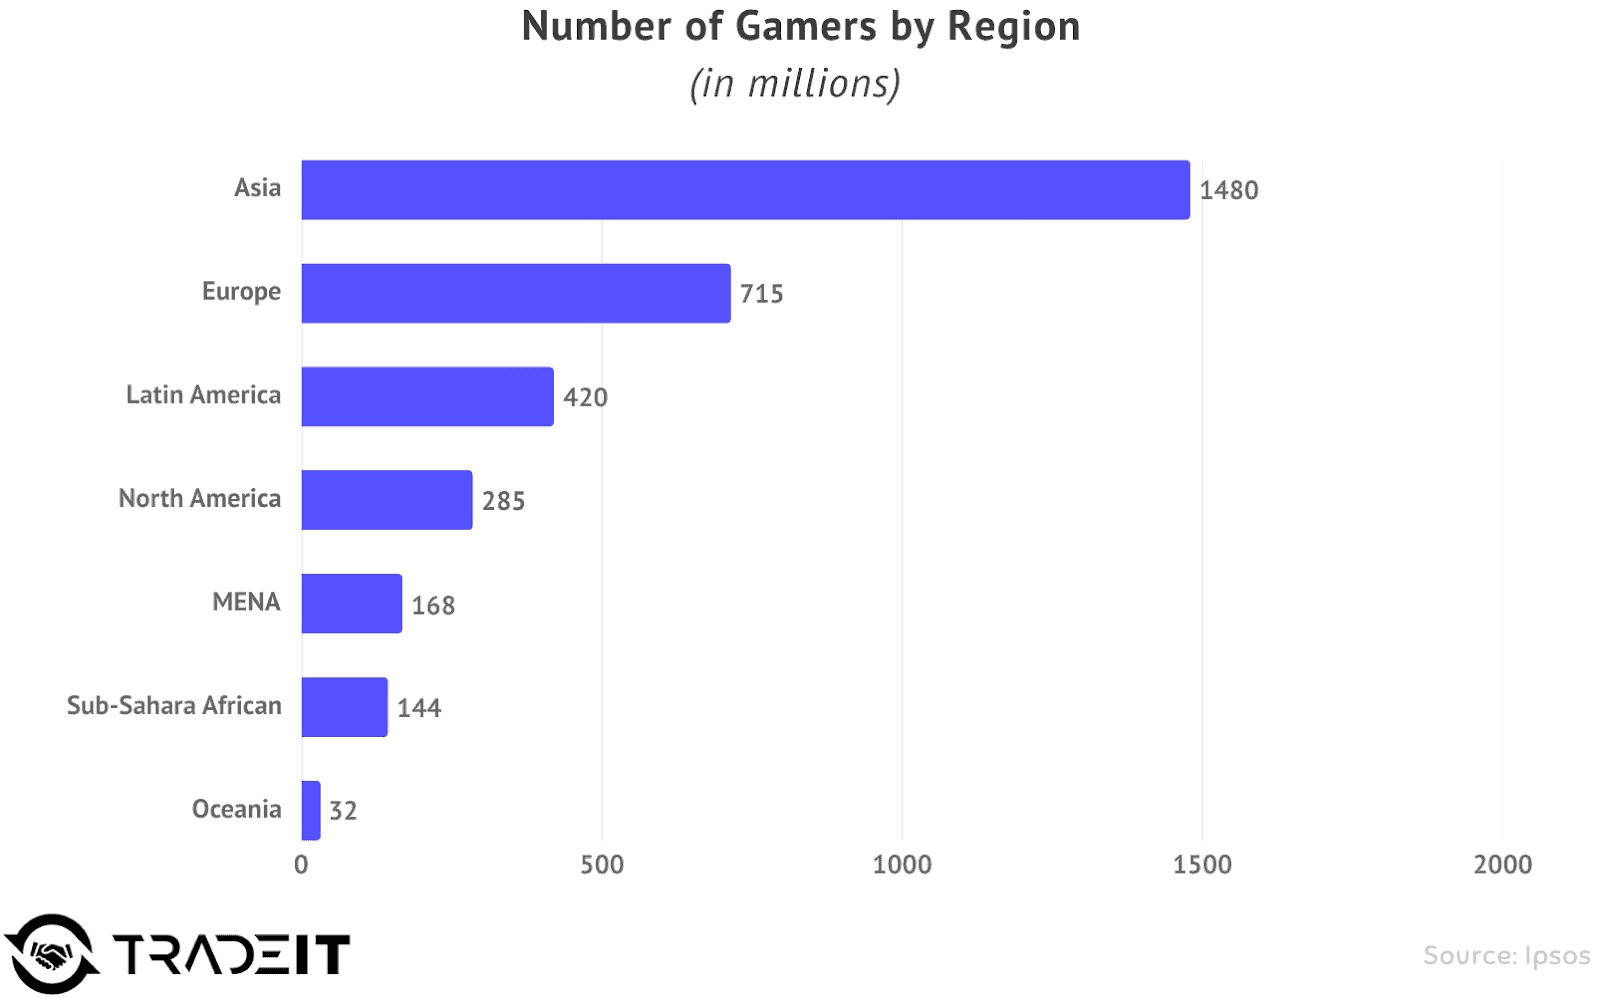
- 1.48 billion players are in Asia, followed by Europe (715M), Latin America (420M), and North America (285M).
- 80% of esports fans are estimated to reside in the APAC region.
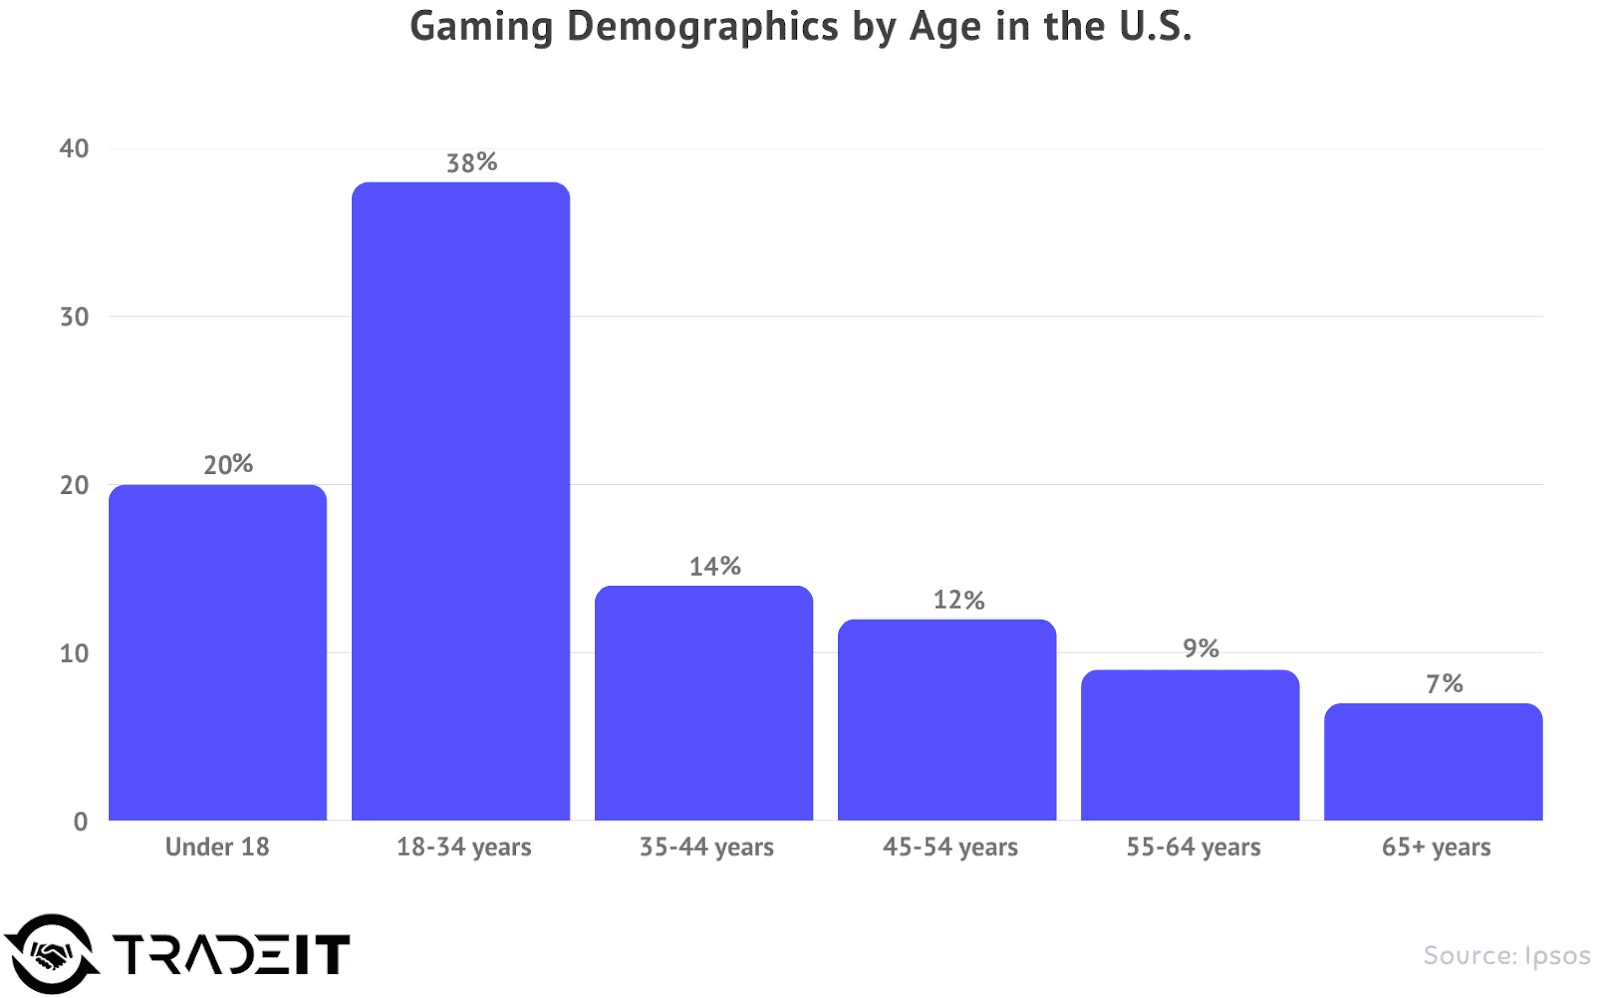
- 80% of gamers globally are over 18 years old.
- 38% of all gamers fall into the 18-34 age group.
- 43% of US 18-34 year olds identify as avid or casual esports fans.
- 53-55% male vs 45-46% female is the approximate gender split for general gaming in the US.
- 17% of male respondents vs 2% of female respondents identified as avid esports fans in a 2023 US survey.
- 14% of Hispanic audiences identified as avid fans in a 2023 US survey.
Major Tournament Viewership
- 6.86 to 6.94 million peak concurrent viewers (PCU) were achieved by the League of Legends World Championship (Worlds) 2024.
- 1.73 million average viewers watched Worlds 2024 over 110 hours, accumulating nearly 191 million hours watched.
- 6.4 million PCUs were achieved by Worlds 2023.
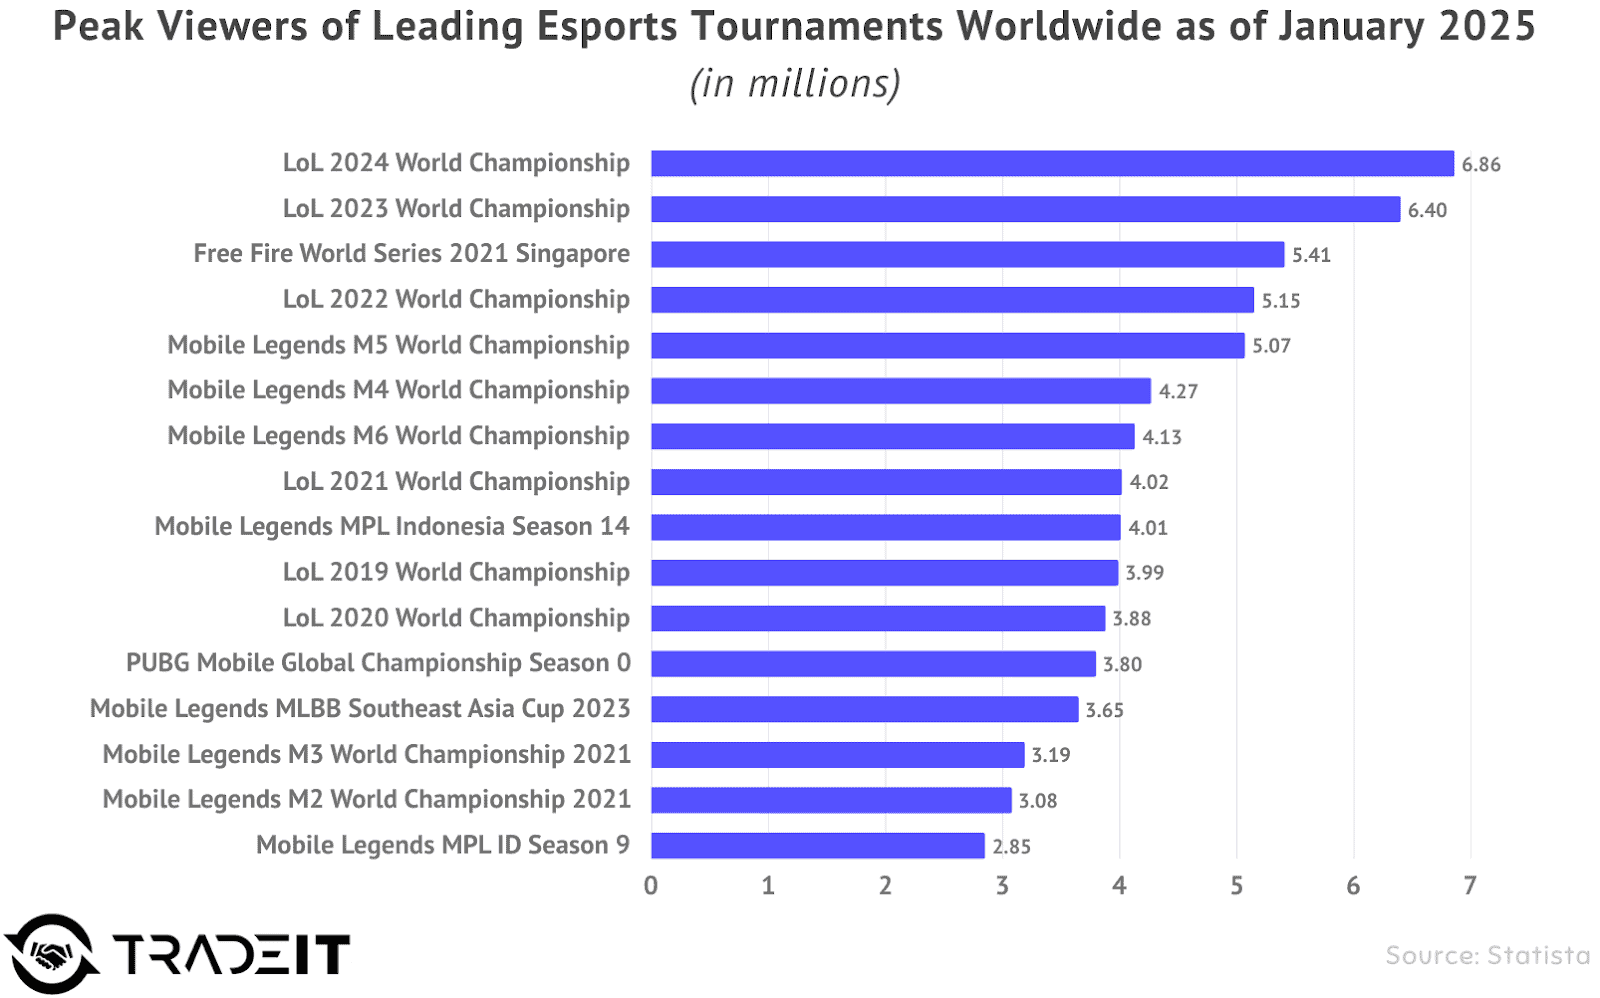
- >4 Million PCU was achieved by the Mobile Legends: Bang Bang M6 World Championship 2024.
- >3 Million PCU was achieved by the EWC x MLBB Mid Season Cup 2024.
- 1.85 million PCU was achieved by the PGL Major Copenhagen 2024 (first CS2 Major).
- 552,223 average viewers watched the PGL Major Copenhagen 2024, totaling 58.3 million hours watched.
- 1.43 million PCU was achieved by The International (TI) in 2024.
- 467,000 average viewers watched TI 2024, totaling 54 million hours watched.
- 1.44 million PCUs were achieved by TI in 2023.
- 541,000 average viewers watched TI 2023, totaling 65 million hours watched.
- 103 million hours watched and 2.8 million peak viewers were garnered by the multi-title Esports World Cup 2024 across all its competitions.
- Over 245,000 peak viewers watched the Call of Duty League’s 2024 Stage 1 Major.
Top Esports Events by Peak Viewership
| Event Name | Game | Peak Concurrent Viewers (PCU) | Average Viewers (AV) | Hours Watched (HW) |
|---|---|---|---|---|
| LoL World Championship 2024 | League of Legends | 6.94 Million | 1.73 Million | 191 Million |
| LoL World Championship 2023 | League of Legends | 6.40 Million | 1.25 Million (est.) | ~198 Million |
| MLBB M6 World Championship 2024 | Mobile Legends: Bang Bang | >4 Million | N/A | N/A |
| PGL Major Copenhagen 2024 | Counter-Strike 2 | 1.85 Million | 552,223 | 58.3 Million |
| The International 2023 | Dota 2 | 1.44 Million | 541,000 | 65 Million |
| The International 2024 | Dota 2 | 1.43 Million | 467,000 | 54 Million |
| Esports World Cup 2024 (Overall) | Multiple | 2.8 Million | N/A | 103 Million |
Popular Games, Genres & Platforms
The shape of esports is set by the games themselves. Just a handful of titles and genres continue to dominate, pulling in the biggest crowds, the largest prize pools, and the most devoted players.
Top Games & Genres
- By Viewership (Q1 2025 Peak):
- 2.8M — Mobile Legends: Bang Bang,
- 1.9M — League of Legends,
- 1.3M — Valorant,
- 1.3M — Counter-Strike,
- 872.6K — Arena of Valor.
- By Cumulative Prize Money (All-Time as of April 2024):
- $346.4M — Dota 2,
- $180M — Fortnite,
- $162M — Counter-Strike: Global Offensive,
- $109M — League of Legends,
- $90M — Arena of Valor.
Platform Dynamics
- 69-72% of total gaming revenue in SEA comes from mobile gaming.
- Smartphones represent the device segment capturing the majority share of the overall esports market based on device type.
Tournament Landscape & Prize Pools
Major esports tournaments represent the pinnacle of competition, and the financial rewards offered reflect the industry’s commercialization. This section examines the scale of these tournaments and recent trends in prize money (2023 onwards).
Recent Prize Pool Landscape
- $3.38 million was the prize pool for The International 2023 (Dota 2).
- $2.78 million was the prize pool for The International 2024 (Dota 2).
- $60 million was the total prize pool offered across over 20 games at the Esports World Cup (EWC) 2024.
- Over $70 million is the announced total prize pool for the EWC 2025.
- $2.225 million was the prize pool for League of Legends Worlds 2024.
- $5 million is the planned prize pool for League of Legends Worlds 2025.
- $1-2 million is the typical prize pool range for CS2 Majors.
Note: The all-time largest prize pool list was removed as most entries were pre-2023.
Event Scale
- Nearly 70,000 tournaments and events have been tracked historically by Esports Charts.
- 56,000 capacity Spodek Arena in Poland was filled for IEM Katowice 2025.
The shift away from Dota 2’s massive crowdfunded prize pools opens the door for other events, like the multi-game EWC, to feature the largest aggregate sums, albeit distributed differently.
Players, Teams & Organizations
Here, the focus shifts to the people at the heart of esports. We look at how many are competing at a high level, who ranks among the top earners (using 2023 and newer data whenever possible), and what the estimates say about player salaries. It’s a glimpse at the human scale—sometimes overlooked, but always central.
Number of Players and Organizations
- Over 2,000 players participated in the Esports World Cup 2024.
- 1,370 distinct esports organizations are registered in the Esports Charts database.
- Over 200 different clubs participated in the EWC 2024.
Top Earners: Players and Teams (Prize Money – Lifetime as of 2024/2025)
- Top Earning Players (Lifetime):
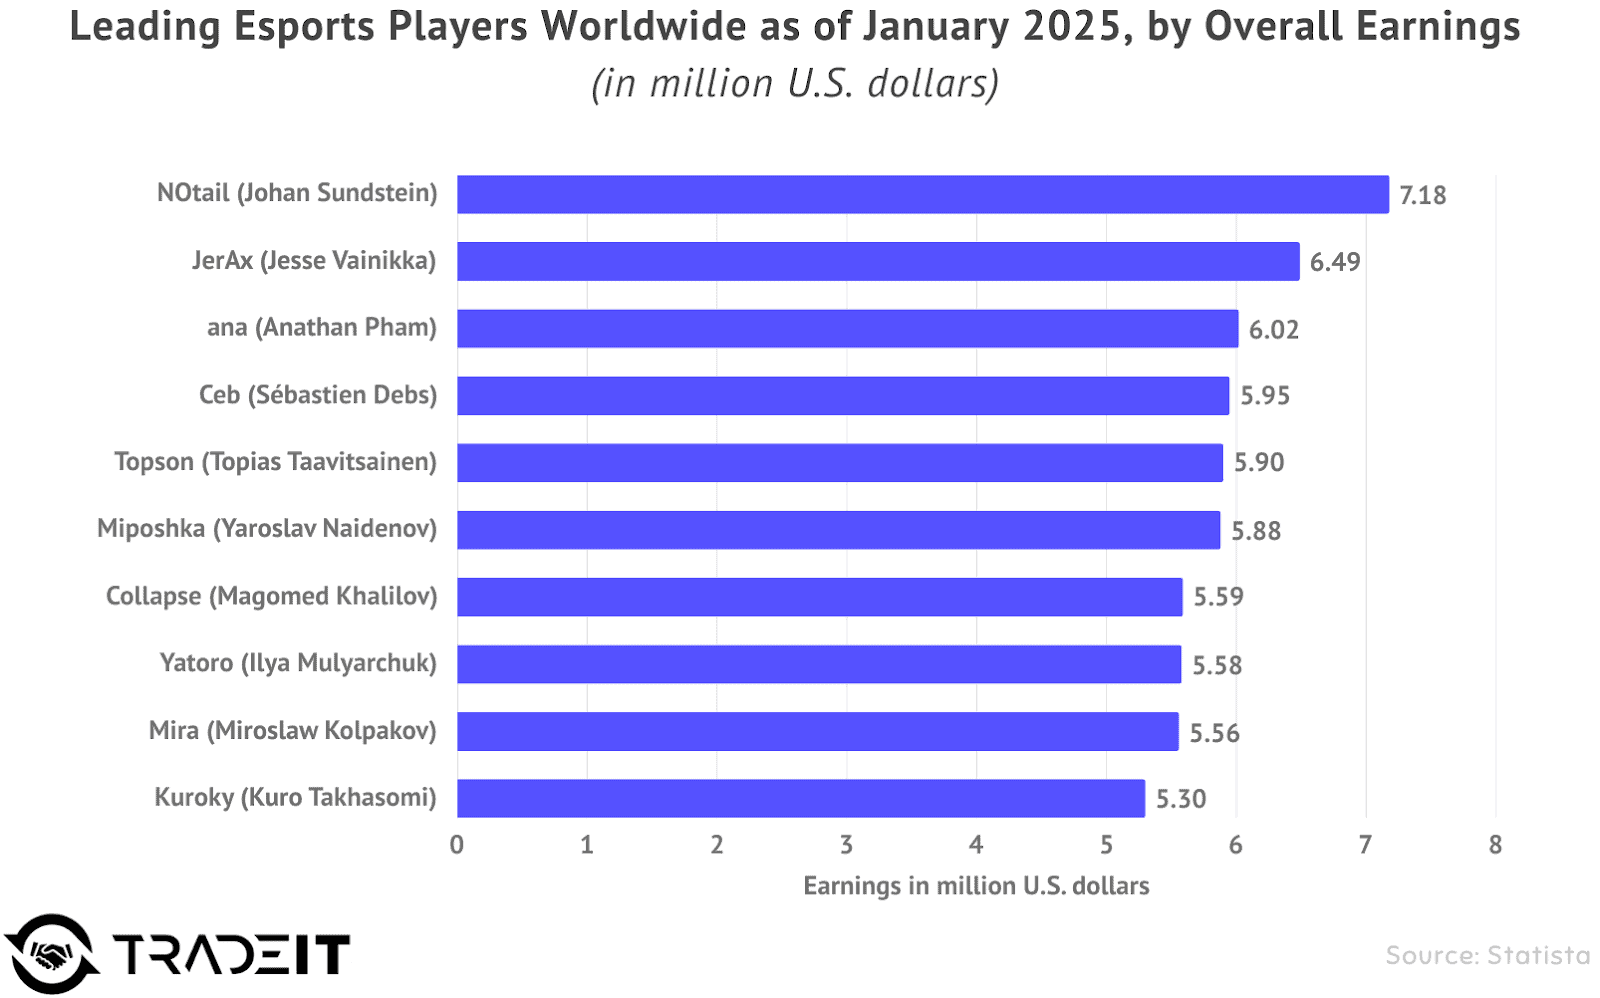
- $7.18 million — Johan “N0tail” Sundstein (Dota 2)
- $6.49 million — Jesse “JerAx” Vainikka (Dota 2)
- $6.02 million — Anathan “ana” Pham (Dota 2)
- ~$3.7M — Kyle ‘Bugha’ Giersdorf (Fortnite)
- ~$2.2M — Peter ‘dupreeh’ Rasmussen (CS:GO)
- ~$1.8M — Lee ‘Faker’ Sang-hyeok (League of Legends)
- $472,110 — Sasha “Scarlett” Hostyn (StarCraft II highest-earning female player)
- Top Earning Teams (Lifetime):
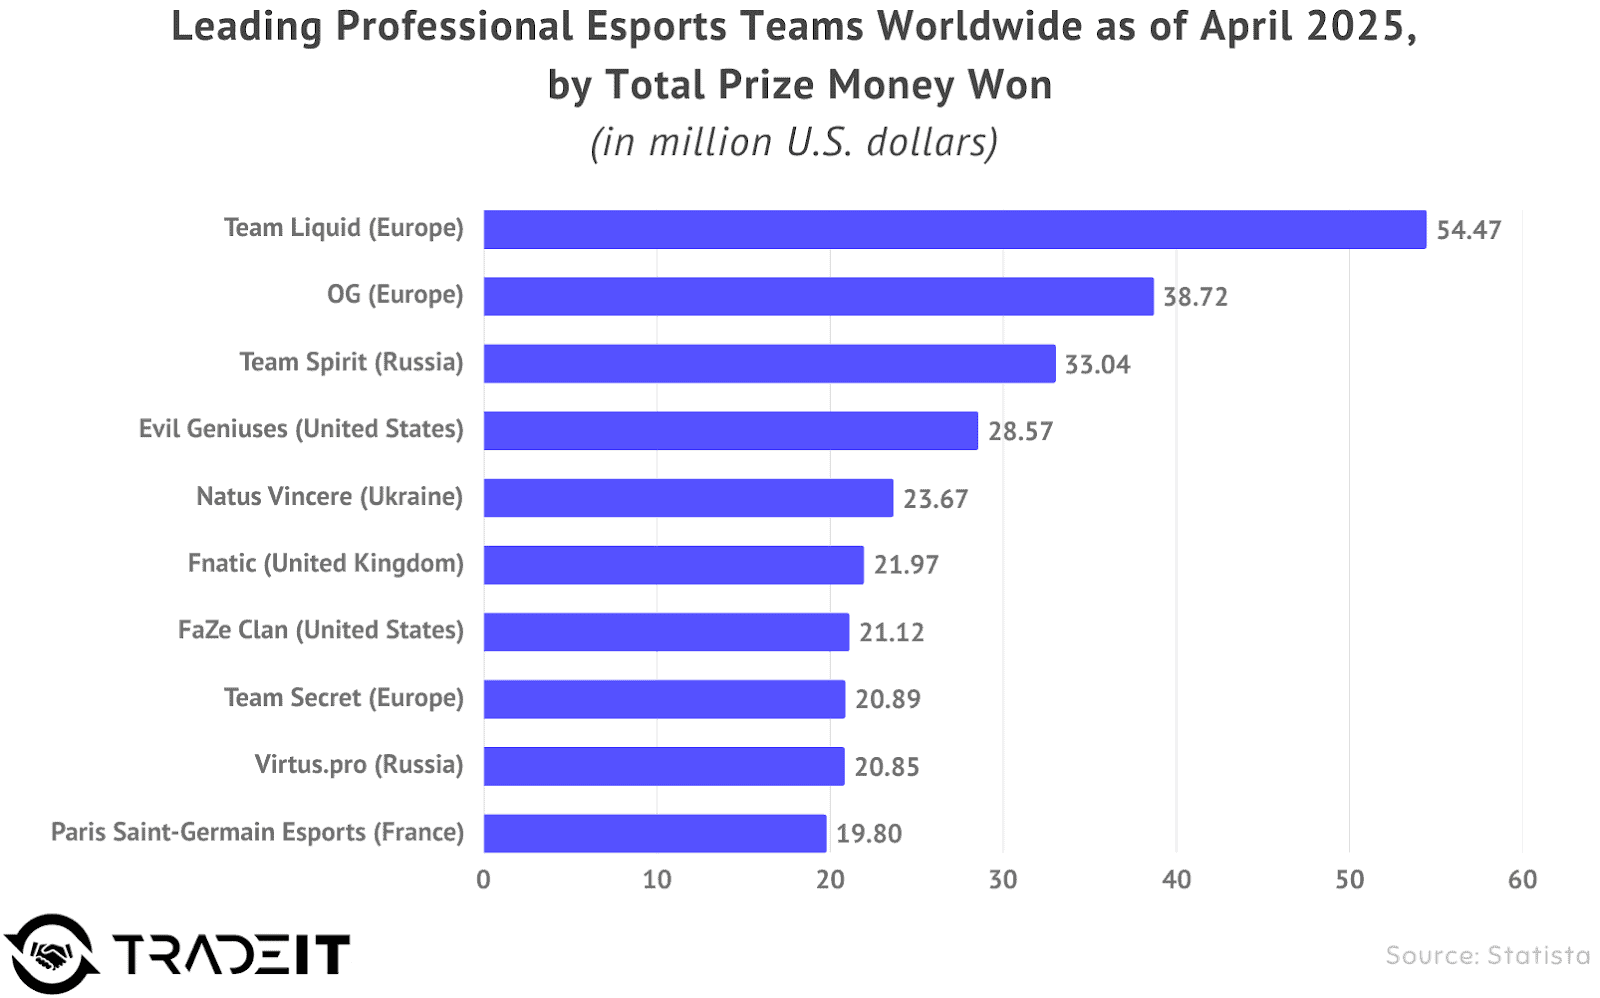
- ~$48.8-$54.8 million — Team Liquid
- ~$38-$38.7 million — OG
- ~$19.9-$31.8 million — Team Spirit
- At least 23 organizations have surpassed $10 million in total prize winnings.
Note: Lifetime earnings reflect historical performance but are presented as current totals.
Player Salary Estimates (2024/2025 Data)
Estimated Annual Salary Ranges for Top-Tier Players (Select Games/Regions – 2024/2025 Data)
| Game | Region | Estimated Salary Range (Annualized USD/EUR) | Notes |
|---|---|---|---|
| League of Legends | LEC (Europe) | €115,000 – €500,000+ | Avg €240k, Median €165k, Rookies ~€115k, Top >€500k+ |
| Valorant | NA (Tier 1) | ~$420,000 – $480,000 | Based on $35k–$40k/month |
| Valorant | EU (Tier 1) | ~$120,000 – $300,000 | Based on avg $10k–12k/month, capped near $25k/month |
| Counter-Strike 2 | Global (T1) | ~$240,000 – $576,000+ | Based on team spend of $100k–$240k/month for 5 players |
Streaming Platforms & Content
Live streaming platforms are the primary venues for consuming esports content.
Platform Market Share (2024 Data)
- 61.1% market share (hours watched) was held by Twitch.
- -A 6.26% year-over-year decline in hours watched was experienced by Twitch in Q4 2024.
- 22.9% market share was held by YouTube Gaming.
- +80% year-over-year increase in hours watched was seen by YouTube Gaming in Q4 2024.
- +207% YoY growth in hours streamed and +205% YoY growth in unique channels occurred on YouTube Gaming in Q4 2024.
- 5.7% market share was captured by Kick.
- +121% year-over-year increase in hours watched was seen by Kick (Q4 2023 vs Q4 2024).
- ~5.4% combined global share was held by SOOP Korea and Chzzk.
- 12% increase in total hours watched across all live streaming platforms occurred in 2024, reaching 32.5 billion hours.
Esports Content Trends on Streaming Platforms (2024 Data)
- 1.3 billion watch hours, representing 45% of all esports viewership, were attributed to co-streamers.
- 3% increase in watch hours and a 32% increase in average viewers occurred for mobile esports titles.
The rapid growth of YouTube Gaming and the massive impact of co-streaming are significantly reshaping the esports broadcasting landscape.
Regional Market Snapshots
Esports growth isn’t uniform worldwide. This section offers regional snapshots—mostly using data from 2023 onward—to highlight those differences. Some gaps are bigger than you might think.
North America (NA)
- Over 44% of the global market share was accounted for by NA in 2023.
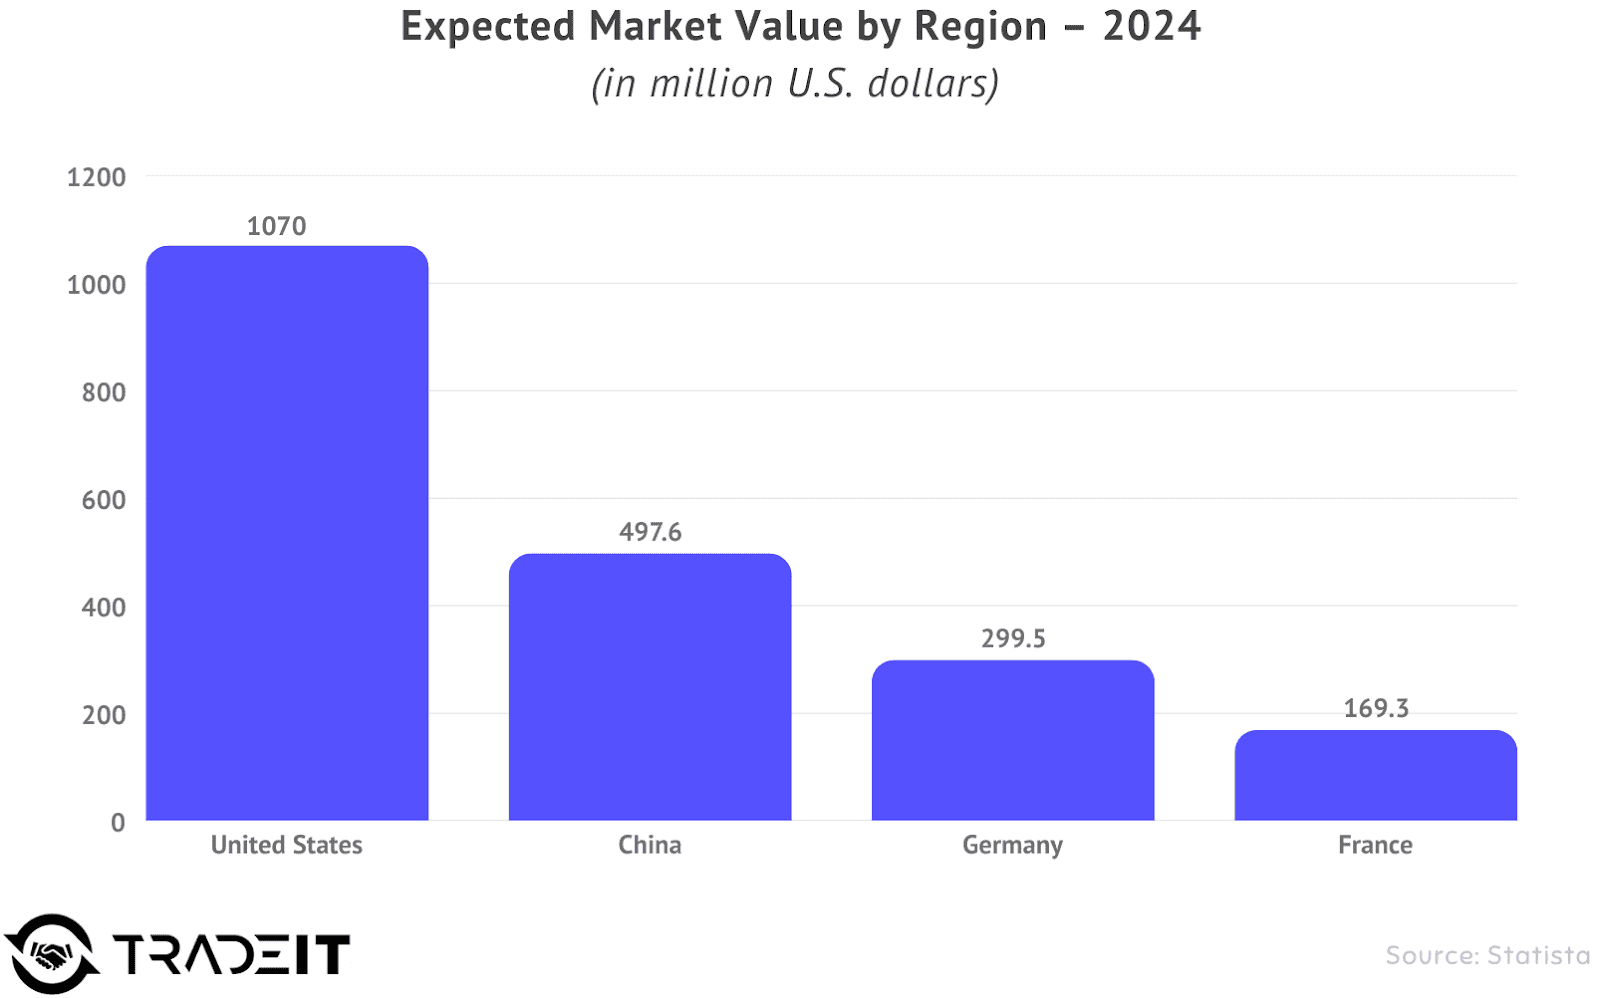
- $1.07 billion was the estimated US market size in 2024.
- $1.595 billion is the projected US market size by 2029.
- $138.9 million is the estimated Canadian market size in 2024.
Asia-Pacific
- 1.48 billion gamers reside in APAC.
- 80% of global esports fans are estimated to be in APAC.
- $498 million is the estimated market value for China.
- 722.5 million gamers were in China in 2024.
- $297.2 million is the projected revenue for South Korea in 2024.
- $5.89 billion was the total SEA gaming market value in 2024.
- 69-72% of gaming revenue in SEA comes from mobile.
Europe
- $299.5 million (Germany) and $169.3 million (France) are key national market estimates.
- $33.6 billion is the estimated value of the overall European gaming market.
Table: Regional Esports Market Comparison (Estimates & Characteristics – 2023+ Focus)
| Region | Est. 2024 Market Size (USD) | Dominant Platform(s) | Key Characteristics / Top Games |
|---|---|---|---|
| North America | ~$1.2 Billion (US+CAN combined) | PC | Large revenue, Pro players, LoL, Valorant, CoD |
| Europe | ~$500 Million+ (National Markets) | PC | Strong PC scene, CS2, LoL (LEC) |
| APAC Overall | >$600 Million | Mobile & PC | Largest audience/fan base, diverse markets |
| China | ~$500 Million | PC & Mobile | Huge gamer base, LoL, Dota 2, Honor of Kings |
| Southeast Asia | ~$80 Million | Mobile | Fastest growth, Mobile Legends, AoV, Free Fire, Valorant |


